active value strategy
investment strategy
The strategy seeks to optimize the performance of value stock portfolios by taking stock market volatility (implicit volatility) into account when constructing the portfolio.
The underlying stocks of the portfolio are value large cap or blue chip stocks, which are highly profitable, have positive free cashflows, have share buy back programs and reasonable valuations.
Amongst the companies on the shortlist are: Berkshire Hathaway, Alphabet, Amazon, O’Reilly Automotive, Microsoft, JP Morgan, Oracle, Goldman Sachs, Meta, Blackrock, Walmart, Nestle, McDonalds, Intercontinental Exchange, Nike, SAP, Accenture, American Express, Adidas, Munich Re, Johnson & Johnson, Target.
A portfolio of such stocks has a very high probability of generating a positive return over the mid to long-run. However, these stocks fluctuate and this fluctuation can be used to generate additional return. If a stock breaks out on the positive side and if the implied volatility is attractive calls can be sold on a portion of the position, meaning the stock will be sold, if it rises further, over the chosen strike price. A premium is earned for that. If the stock is sold and the stock price falls again, a put can be sold, to buy the stock back, if the price falls below the strike. Again, a premium is earned. Also, if a cycle like this occurs the stock is sold high and bought low, so more return was generated than just having held the stock the entire time.
This strategy causes the portfolio to usually consist of a mix of stocks, cash and option positions, making it a multi asset portfolio.
However, the portfolio also takes general market volatility and implied volatility of the options markets into account to construct the portfolio. At times, the market volatility can be sufficiently high that having exposure through short put options on a stock has a more interesting risk/return profile than holding the stock outright. So strikes can be chosen to be a bit further out of the money and still the option premium earned can be sufficiently attractive to prefer this option position over an outright investment.
The portfolio will also consist of option positions in the VIX or on the VXX (an ETN on the VIX). Especially when single stock volatility is not so high, but there is cash in the portfolio to serve as collateral for stock market exposure, calls can be written on these products. Again, it earns a yield and will most of the time expire worthless. The risk is a rising volatility level in the market, which cause losses in these positions, but will enable selling puts on single stocks again at much more advantageous price levels.
When market volatility is low and single stock volatility is low and a specific stock is at a very attractive price level, starting an uptrend, exposure can also be built up using long single stock calls.
With this strategy, the portfolio “breathes with the market”. With rising markets, risk tends to be reduced by selling calls on stock positions and eventually stocks being called. With falling markets, exposure tends to be built up, by selling puts on value stocks which have fallen in price or selling calls on volatility indices until attractive positions on value stocks open up. Meanwhile, attractive option premiums are continuously being collected, which generally enable a steady, fundamental uptrend in the portfolio.
Head of Asset Allocation GCP Asset Management
Risk Profile

Low

Low to
moderate

Moderate

Moderate to
high

High
General Information
| Domicile | Cayman Islands |
| Fund Manager | GCP Asset Management |
| Fund Administrator | OM24 |
| Custodian | SBM |
| Auditor | Bakertilly |
| Fund Currency | USD |
| Target Investor | Qualified investor |
| Minimum Investment | 100.000 USD |
| Lock-In | 12 Months |
| Liquidity | Monthly |
| Valuation | Monthly |
| Isin -Number | KYG2162E1026 |
Fee Structure
| Maximum Initial Charged* | 5% |
| Management fee | 2% |
| Performance fee | 20% |
| High Watermark | YES |
*This represents the advisory fee which may be charge by your intermediary.
contact us
Email: info@citioncapital.com
Website: www.citioncapital.com
general risk management
The strategy is subject to single stock risk as well as to market risk. In order to manage single stock risk, it is aimed to hold a wide diversification of stocks. Market risk / market volatility is actually regarded as positive in this strategy. The stocks selected for the portfolio are assumed to perform well over the long-term. Therefore, if the market falls and the stock with it, this is usually regarded as a purchase opportunity.
As the strategy makes use of options, especially short options, the exposure to implied volatility levels is probably the major risk. A sharp rise in volatility will cause these positions too lose value over proportionally in the portfolio. Managing this risk is therefore key. Options are therefore carefully staggered by strike price and maturity. Again, rising volatility will be positive in the mid to long-term for this strategy.
In order to control risk, the portfolio is turned over only gradually over time, mainly by having options expire in the money, thereby reducing or building equity positions.
investor risk profile
The strategy is suitable for investors looking to achieve long-term growth of capital, accepting a high degree of risk. Especially in times of market distress the strategy is subject to high volatility, which demands certain recovery periods until market volatility has normalized. Investors should therefore be ready, willing and able to accept volatility in their portfolio
HISTORICAL PERFORMANCE
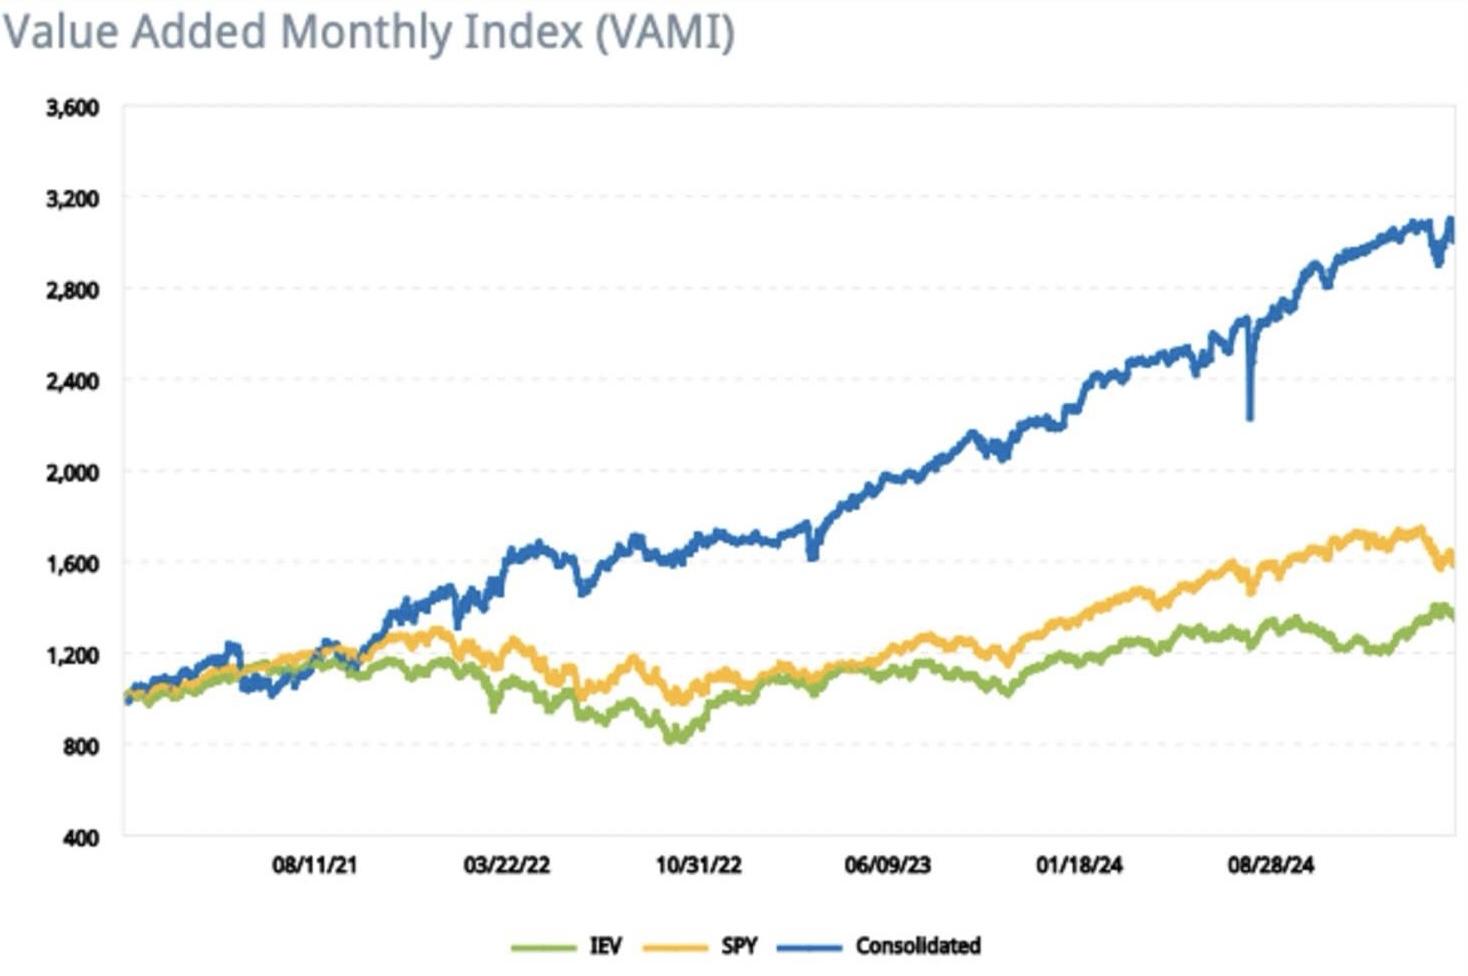
The historical performance indicates very well the underlying uptrend due to the continuous earnings generated by options writing. As exposure is slowly reduced in rising equity markets and only slowly rebuild in falling equity markets, the correlation to markets is muted.
At the same time, volatility in the strategy can be induced by factors, which are less apparent in the general market performance, such as spikes of implied volatility.
| IEV | SPY | Consolidated | |
|---|---|---|---|
| Ending Vami | 1,114.99 | 1,256.39 | 2,094.29 |
| Max Drawdown | 30.55% | 24.50% | 13.45% |
| Peak-To-Valley | 11/03/21 - 09/27/22 | 01/03/22 - 10/12/22 | 04/28/22 - 06/16/22 |
| Recovery | Ongoing | Ongoing | 42 Days |
| Sharpe Ratio | 0.10 | 0.34 | 1.21 |
| Sortino Ratio | 0.14 | 0.48 | 1.73 |
| Standard Deviation | 1.18% | 1.12% | 1.33% |
| Downside Deviation | 0.82% | 0.79% | 0.93% |
| Correlation | 0.36 | 0.47 | - |
| ß: | 0.40 | 0.56 | - |
| α: | 0.25 | 0.23 | - |
| Tracking Error | 1.43% | 1.28% | - |
| Information Ratio | 68.67 | 65.72 | - |
| Turnover | - | - | 183.38% |
| Mean Return | 0.02% | 0.04% | 0.12% |
| Positive Periods | 373 (53.67%) | 374 (53.81%) | 383 (55.11%) |
| Negative Periods | 322 (46.33%) | 321 (46.19%) | 312 (44.89%) |
The direct comparison of the strategy to the SPY (SPDR S&P 500) as well as to the IEV (ishares S&P Europe 350 Index) clearly indicate the advantageous risk-return metrics over the period.
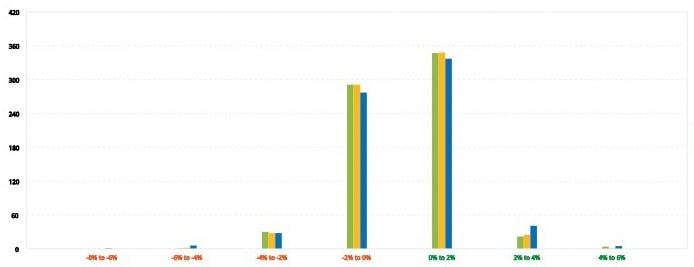
DISTRIBUTION OF RETURNS

The return distribution shows the longer tail of negative distributions of the strategy, indicating that volatility risk can hit the strategy quite hard in short time periods.

